
One of the million dollar questions in event marketing is “how do you attract attendees”. To try and answer it, we’ve created The B2B Event Marketing Guide, a 15 chapters report on the full marketing strategy and planning process that goes behind a business event.
The article below is an excerpt from the guide. Find the other chapters here.
In this section: Post event surveys and campaign analysis documents. What KPIs to track for event marketing and how to measure performance.
We have discussed KPIs for each channel in their respective sections, but at the end of each event you will want to conduct an analysis and review KPIs for the entire campaign. As mentioned, customers often engage with multiple interaction points, so it’s sometimes hard to attribute results to a single channel.
It’s good practice to run a post event survey for event attendees and get their feedback on their event experience and any marketing activity you want to review.
This is the time to ask about things that are relevant for other members of your team (such as speakers, venue, catering, etc), but also that are relevant to you (such as gathering testimonials, how did they find out about the event, how likely they are to recommend it and to join again, etc). Here are a few examples of event survey questions to ask.
Your event survey will be relevant when you get several attendees to fill it in (more is better). In order to set it up for success, aim for 15-20 questions maximum, keep open ended questions down to minimum and consider offer an incentive for survey respondents, like a prize via a raffle.
Survey respondents can be linked with information in your CRM or your registration form, so this can also be an opportunity to update your data. After you have all the information put together, you will be able to create reports based on customer profiles.
Campaign analysis report
Next, it’s time to create a campaign analysis report. This should contain:
– An overview of marketing channels used, including performance & budget for each one
– The drop plan of marketing activities, including actual dates instead of projected ones
– Survey results
– Team feedback from on-site, collected immediately after the event, whilst it’s still fresh
Include personal observations in the campaign analysis. In most cases, you will be able to track past results even without an analysis document, but you won’t be able to remember all your personal observations.
The campaign analysis will be the starting point for the next edition or for future events, since you’ll want to incorporate your findings in your new campaign.

The goal of your analysis is to answer a few questions:
1. Have we reached our KPIs for the event? More on this below
2. Have we generated a good number of leads? Is their quality satisfactory? Would these convert to event attendees later on?
3. Did we provide a good customer experience, from registration to attendance? Where can we improve
Now is also the time to follow up with your event attendees. As your relationship doesn’t end when they register, nor should it end when they attend.
Keep them engaged by offering them access to the presentations, pictures and/or videos from the event. Remind them of the survey, where they can offer any feedback, good or bad. Mention ways they can keep in touch with your brand, invite them to register to your newsletter, follow your social accounts and present any future events that would be relevant for them.
Reports state it costs five times as much to attract a new customer than to keep an existing one (source) and it’s never too early to start engaging your audience.
Event marketing KPIs
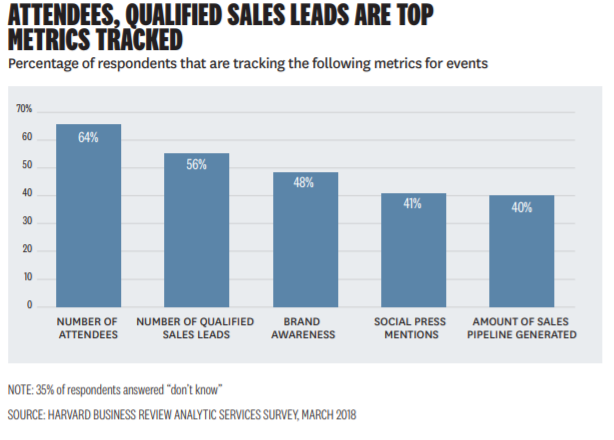
Let’s see what other B2B event marketers are tracking as KPIs. After total number of attendees/visitors/participants, the total number of qualified leads (65%) is the next-most common piece of data, followed by the total number of all leads (57%) and social media activity, postings (also 57%). (source)
These metrics are most probably being used by B2B marketers who work for a solution provider and that run events to reach their business objectives, rather than by event marketers, though they will be relevant for both categories.
Things to review in your campaign analysis:
– Ticket revenue and average price point. We obtain average price point by dividing the total ticket revenue by paid attendees, which shows how much you’ve discounted your standard rates.
– Marketing cost per attendee. Divide your marketing budget to the number of attendees (paid and free, but exclude speakers and sponsors) to understand how much you’ve spent to get 1 attendee to your event.
– Cost per attendee. Include all costs associated with the event (logistics, sales, production & marketing) and compare this to revenue per attendee (this time including sales revenue).
– Free/paid ratio. As mentioned above, free attendees also have costs associated to them, like catering and marketing costs, so you’ll want to aim for a maximisation of your revenue from paid attendees that can cover any free ones.
– Retention rate. How many of previous event attendees have returned for the current event? Calculated as number of returned customers divided by total number of customers in the previous year. We aim for a 40-60% rate.
– Performance of marketing channels. Based on campaign tracking (conversion in Google Analytics, CRM, etc) and post event survey, which was the channel that brought in the most registrations? At what revenue and what cost?
– Quality of leads. Are your leads relevant for your target market? Have the sales leads converted into contracts? What is the probability they will become future sponsors or attendees?
– User experience – before and during event. Review your customer survey, any feedback you’ve received by phone or email during the campaign and app data to review user experience and propose improvements.
You can also track indicators such as brand sentiment and net promoter score (NPS), to understand how positive or negative are the feelings of people discussing about your brand online and how likely they are to recommend this.
The bigger your brand, the more you’ll want to track these metrics and review how they are performing before, during and after your event. More on sentiment analysis and net promoter score here.
Plus, here is a review of indicators and tools to measure event marketing performance.
Key takeaways: Create a post event survey that reviews attendee experience at the event, then include results in the campaign analysis. Add your personal observations to the analysis report and review the KPIs you have reached.
If you’re interested in The B2B Event Marketing Guide, fill in the form below to download it:
Pingback: 10 questions to get more leads from your events